Q1. What do you understand by mapping of science? Discuss the above concept encompassing all scientometric maps.
Answer:Mapping of Science:
Mapping of science refers to the visual representation of the structure, development, and interconnections of scientific knowledge across disciplines, topics, or time. It is a methodological approach used in scientometrics, bibliometrics, and information science to analyze the dynamics of scientific research and knowledge production. These maps are often constructed using large datasets of scholarly publications, citations, keywords, or authorship patterns to uncover hidden structures, trends, or influential elements within the scientific ecosystem.
The goal of science mapping is to provide a systematic overview of the intellectual landscape of science: what topics are emerging, how disciplines are connected, which researchers or institutions are leading in certain fields, and how knowledge evolves over time. By doing so, it supports strategic research planning, funding allocation, science policy, and academic evaluation.
Mapping science involves the application of data mining, network analysis, clustering algorithms, and visualization techniques. These methods help identify and display relationships such as co-authorship, co-citation, keyword co-occurrence, and citation flows.
Types of Scientometric Maps
Scientometric maps can be categorized based on the entities they analyze and the relationships they explore. Major types include:
1. Co-citation Maps
Co-citation mapping identifies relationships between documents, authors, or journals that are cited together in later works. If two papers are frequently cited together, they are likely to be conceptually related. Co-citation maps help identify research fronts, schools of thought, or core literature in a given field.
- Author co-citation analysis (ACA): Maps networks of authors who are frequently cited together.
- Document co-citation analysis (DCA): Focuses on papers or books cited together.
- Journal co-citation analysis (JCA): Used to study journal influence and disciplinary boundaries.
2. Co-authorship Maps
These maps represent collaborative relationships between researchers, institutions, or countries. Nodes represent authors or institutions, and edges indicate co-authored publications. Such maps help understand research collaboration patterns, identify key collaborators, and analyze interdisciplinary efforts.
3. Keyword Co-occurrence Maps
In keyword mapping, terms or phrases extracted from titles, abstracts, or keyword fields are analyzed to uncover thematic structures. Keywords that frequently appear together suggest emerging or established research areas. These maps are used for topic modeling, trend analysis, and research forecasting.
4. Citation Networks
Citation maps trace the flow of knowledge by mapping citations between papers, journals, or researchers. They help identify influential works, intellectual lineage, and the evolution of scientific paradigms.
5. Thematic Maps
Thematic maps cluster documents or keywords into major themes or topics. These are usually derived from topic modeling or clustering algorithms (e.g., LDA, k-means). Thematic mapping is crucial for summarizing large bodies of literature.
6. Overlay Maps
Overlay mapping allows one to superimpose new data (e.g., recent publications, specific institution output) onto a base science map. This is useful for comparing research output across disciplines, institutions, or countries.
Applications of Science Mapping
- Identifying emerging areas of research
- Supporting research policy and strategic funding
- Mapping interdisciplinary interactions
- Benchmarking scientific performance
- Understanding the structure and growth of knowledge domains
Q2. What is scientific productivity? Discuss the problem of its measurement.
Answer: Scientific productivity refers to the output of scientific research by an individual, group, institution, or nation over a specific period. It is a key concept in scientometrics and research evaluation, reflecting the extent to which scientists contribute to the advancement of knowledge through publications, patents, technologies, or innovations.
Traditionally, scientific productivity has been quantified by counting research outputs, such as:
- Number of published papers
- Number of books or book chapters
- Number of conference proceedings
- Number of patents filed or granted
- In some cases, the development of software, datasets, or scientific tools
At the individual level, scientific productivity is often equated with how many articles a scientist publishes. At the institutional or national level, it includes aggregated research outputs across multiple disciplines.
However, productivity in science is not merely about quantity. It must also consider the quality and impact of the work. For instance, a researcher who publishes fewer but highly cited papers may be more productive (in terms of value or impact) than one with a high number of low-impact publications.
Dimensions of Scientific Productivity
Scientific productivity can be assessed across multiple dimensions:
- Quantitative Productivity: Number of outputs (e.g., publications).
- Qualitative Productivity: Scientific impact measured through citations, journal quality, or peer review.
- Collaborative Productivity: Contributions made through partnerships, co-authorship, or international cooperation.
- Innovative Productivity: Measured through patents, technological breakthroughs, or commercial applications.
- Disciplinary and Interdisciplinary Productivity: Measuring contributions to single or multiple fields.
Problems of Measuring Scientific Productivity
Despite its importance, measuring scientific productivity is fraught with challenges, limitations, and biases. Here are some of the main problems:
1. Over-Reliance on Publication Counts
Counting publications without considering their quality can misrepresent productivity. A large number of low-impact papers may inflate perceived productivity, while fewer high-impact papers might be undervalued.
2. Citation Bias and Field Differences
Citation practices vary across disciplines. For example, researchers in biomedicine or physics may publish more and receive more citations than those in humanities or social sciences, where monographs and qualitative research dominate. Comparing productivity across fields without normalization can be misleading.
3. Authorship Inflation
Multi-authored papers are becoming more common, especially in large-scale or collaborative projects. Determining individual contributions is challenging. In many cases, the credit for a paper is divided equally, even if some authors contributed minimally.
4. Time Lag in Impact
Scientific work often takes years to gain recognition or accumulate citations. A recently published paper may appear unproductive initially, even if it becomes highly influential later.
5. Quantity vs. Quality
A focus on productivity metrics may push researchers to prioritize quantity over quality, leading to:
- Salami slicing (publishing minimal publishable units)
- Predatory publishing
- Repetition of work for the sake of publication
This may ultimately reduce the integrity and originality of research.
English-language publications dominate major databases like Web of Science and Scopus. Researchers publishing in other languages or from developing countries are often underrepresented, skewing global productivity metrics.
6. Inadequate Representation of Non-Published Work
Many valuable scientific activities, such as mentoring, peer reviewing, fieldwork, and software development, do not result in traditional publications but are vital to the research ecosystem. These are often ignored in productivity assessments.
7. Gender, Language, and Regional Bias
Q3. Define and explain cluster analysis. Elucidate measurement of distances relating to cluster analysis.
Answer: Cluster Analysis: Definition and Explanation
Cluster analysis is a statistical technique used to group a set of objects (such as people, documents, genes, or data points) in such a way that objects within the same group (called a cluster) are more similar to each other than to those in other groups. It is a type of unsupervised learning used in data mining, machine learning, pattern recognition, and scientometrics to discover structure in data without predefined labels.
The main goal of cluster analysis is to identify hidden patterns or groupings in data. For example:
- In marketing, it helps segment customers based on behavior.
- In biology, it groups organisms by genetic similarity.
- In bibliometrics or scientometrics, it clusters research articles based on citation or keyword similarity.
There are several approaches to cluster analysis, including:
- Hierarchical clustering – builds a tree (dendrogram) of clusters.
- K-means clustering – partitions data into a predefined number of clusters (k).
- DBSCAN (Density-Based Spatial Clustering) – clusters based on density and noise detection.
- Fuzzy clustering – allows data points to belong to more than one cluster with varying degrees of membership.
Despite their differences, all clustering methods rely heavily on measuring similarity or dissimilarity, often through the use of distance metrics.
Measurement of Distances in Cluster Analysis
At the heart of cluster analysis is the concept of distance. Measuring how “far apart” two data points are helps determine whether they should be in the same cluster or not. The most commonly used distance (or dissimilarity) measures include:
1. Euclidean Distance
The most widely used metric, especially in K-means and hierarchical clustering.
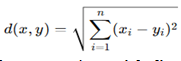
It measures the straight-line distance between two points in n-dimensional space.
- Works best when variables are on the same scale.
- Sensitive to large values and outliers.
2. Manhattan Distance (City Block Distance)
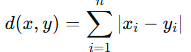
Measures the sum of absolute differences across dimensions—like navigating a city grid.
- Less sensitive to outliers than Euclidean.
- Useful when differences across dimensions should be treated equally.
3. Cosine Similarity / Distance
Often used for text mining or high-dimensional sparse data.
Cosine similarity
Cosine distance = 1−cosine similarity1 – \text{cosine similarity}1−cosine similarity
- Measures the angle between two vectors.
- Values range from 0 (same direction) to 1 (orthogonal).
4. Mahalanobis Distance
Accounts for correlations between variables and data variance.
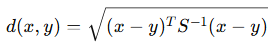
Where SSS is the covariance matrix.
- More accurate in cases where variables are correlated.
- Used in advanced clustering or anomaly detection.
5. Jacquard Distance
Used for binary or categorical data (e.g., presence/absence).
Jaccard similarity
Jaccard distance=1−Jaccard similarity
Useful in document clustering or web data.
Choice of Distance Metric
The choice of distance measure significantly influences the results of clustering:
- Numerical data: Euclidean or Manhattan.
- Textual or sparse data: Cosine or Jaccard.
- Correlated or multivariate data: Mahalanobis.
Preprocessing like standardization or normalization is often necessary to ensure meaningful results.
Q4. Write an essay on “user studies”.
Answer: User studies are a crucial component in the fields of information science, library science, human-computer interaction (HCI), and information systems. These studies focus on understanding the behaviors, needs, preferences, experiences, and interactions of users when they seek, retrieve, use, or evaluate information or systems. The primary goal of user studies is to develop user-centered services, systems, or products that effectively meet the needs of the target audience.
Definition and Scope
In its broadest sense, a user study is any research that involves observing or analyzing users to gain insights into their actions, motivations, or challenges. In library and information science, user studies typically explore how individuals seek information, what sources they use, how they evaluate credibility, and how they interact with catalogs, databases, or digital libraries.
User studies can be qualitative, quantitative, or mixed-methods, depending on the research question. They may involve surveys, interviews, focus groups, usability testing, eye tracking, or observational methods.
Historical Context
User studies have evolved significantly since the 1940s and 1950s, when early research focused mainly on library usage statistics. The 1970s and 1980s marked a shift toward user-centered approaches, emphasizing the information needs and seeking behaviors of users. With the rise of digital technology, user studies expanded to include interaction with digital interfaces, search engines, web platforms, and mobile applications.
Today, user studies are a core part of designing information retrieval systems, user interfaces, websites, and digital services in various sectors including education, healthcare, e-commerce, and government.
Importance of User Studies
- Understanding User Behavior: They help identify how users search for and consume information, their pain points, and their decision-making processes.
- Improving System Design: Insights from user studies guide the development of intuitive interfaces, efficient navigation, and relevant content.
- User Satisfaction: Systems designed based on user feedback tends to offer better user experience (UX), increasing satisfaction and retention.
- Policy and Planning: In libraries or public service institutions, user studies support data-driven planning and resource allocation.
- Customization and Personalization: Understanding user preferences allows for personalized recommendations and adaptive interfaces.
Methodologies in User Studies
- Surveys and Questionnaires: Useful for gathering structured data from large samples.
- Interviews: Provide deeper insights into user motivations and experiences.
- Focus Groups: Encourage discussion and bring out diverse perspectives.
- Usability Testing: Evaluates the user-friendliness of systems or websites.
- Observational Studies: Capture real-time user interactions with systems.
- Log Analysis: Involves mining user activity logs for behavioral patterns.
Challenges in User Studies
- Diversity of Users: Different backgrounds, education levels, and tech proficiency can influence behavior.
- Ethical Considerations: Respecting user privacy, consent, and data protection is essential.
- Dynamic Behavior: User needs and behaviors change over time, requiring continuous study.
- Data Interpretation: Converting raw data into actionable insights can be complex.
Q5. Write short notes on any two of the following:
a) Measures of central tendency
b) Testing of a questionnaires
c) User studies
d) In formativeness
Answer: a) Measures of Central Tendency
Measures of central tendency are statistical tools used to summarize a set of data by identifying the central point within that dataset. They provide a single value that represents the entire distribution and are essential in data analysis for drawing meaningful conclusions about a population or sample.
The three most commonly used measures are:
1. Mean (Arithmetic Average)
The mean is calculated by adding all values in a dataset and dividing the sum by the total number of values.
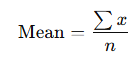
Advantages: Simple to compute and understand; uses every value in the dataset.
- Disadvantages: Sensitive to extreme values or outliers, which can distort the result.
2. Median
The median is the middle value when the data is arranged in ascending or descending order. If the number of observations is even, the median is the average of the two middle values.
- Advantages: Not affected by outliers or skewed data.
- Disadvantages: Does not consider all data values; less sensitive to data distribution.
3. Mode
The mode is the value that appears most frequently in the dataset.
- Advantages: Useful for categorical data or when identifying the most common item.
- Disadvantages: A dataset can have no mode or multiple modes, which complicates interpretation.
Other Measures
- Geometric Mean: Used primarily for data with exponential growth, such as population or financial returns.
- Harmonic Mean: Useful when dealing with rates (e.g., speed or ratios).
Applications
Measures of central tendency are widely used in:
- Economics (e.g., average income)
- Education (e.g., average test scores)
- Health research (e.g., average blood pressure)
- Social sciences (e.g., median age)
Choosing the Right Measure
- Use mean when data is symmetrical and free of outliers.
- Use median for skewed distributions.
- Use mode for categorical or nominal data.
b) Testing of a Questionnaire
Testing a questionnaire is a vital step in survey research and data collection that ensures the questionnaire is valid, reliable, clear, and capable of capturing the desired information accurately. Testing helps identify issues before the full-scale study is conducted, ultimately improving the quality of the research.
Purpose of Testing a Questionnaire
- Ensure clarity of questions
- Assess reliability and validity
- Identify ambiguous or leading questions
- Estimate time required to complete
- Check the sequence and flow of questions
Types of Testing
1. Pre-testing (Pilot Study)
A small version of the full study is conducted with a sample from the target population. This helps test how respondents interpret and respond to the questionnaire.
2. Cognitive Interviewing
Respondents are asked to verbalize their thought process while answering the questions. This reveals misunderstandings, misinterpretations, or ambiguities.
3. Focus Groups
Groups of participants discuss their interpretation of questions, helping identify confusing or culturally sensitive content.
4. Field Testing
The questionnaire is tested under actual survey conditions with a limited number of respondents to see how it performs in real settings.
Criteria for Evaluation
- Validity – Does the questionnaire measure what it is intended to measure?
- Reliability – Are the results consistent across time and different respondents?
- Comprehensibility – Are the questions easily understood?
- Relevance – Are the questions appropriate to the research objectives?
- Length and Flow – Is the questionnaire too long or poorly structured?
Common Issues Identified During Testing
- Ambiguous wording
- Double-barreled questions (asking two things in one)
- Technical jargon or unfamiliar terms
- Inappropriate response options
- Leading or biased questions
Post-Testing Modifications
Based on testing results, the researcher may:
- Reword unclear questions
- Remove or replace problematic items
- Adjust question order
- Add instructions or examples
- Shorten the questionnaire